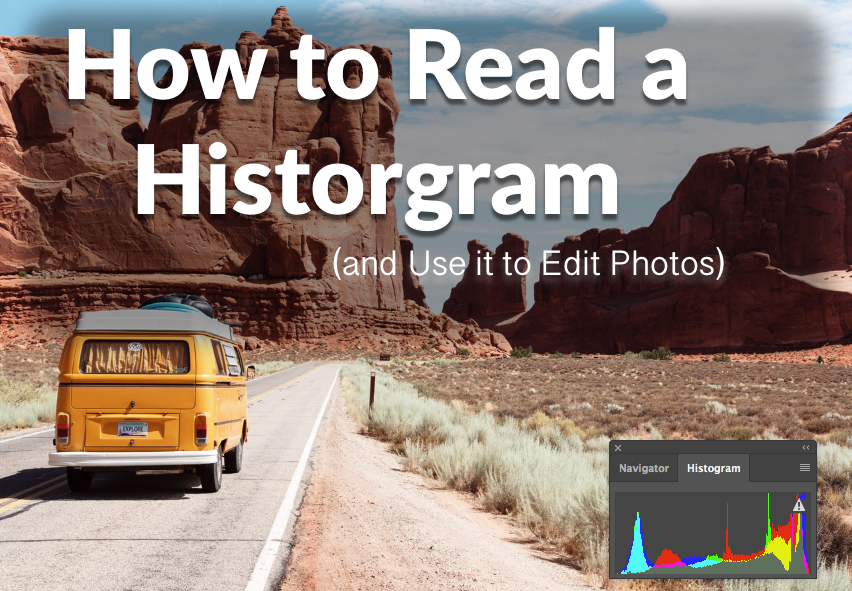
You’ll find histograms everywhere in photography. They’re important elements in many apps—including Photoshop and Lightroom. And some cameras have built-in histogram features. But what is a histogram? And how can you put it to use? Follow these tips to learn how to read a histogram and use this knowledge to perfect every photo.
How to Read a Histogram: 4 Tips for Using Histograms to Correct Lighting/Exposure
- Understand Fundamental Facts About Histograms
- Identify the Shape of an Ideal Histogram
- Know When Your Histogram Reveals an Over or Underexposed Image
- Learn How to Use a Histogram to Edit Photos
A histogram is an essential photography tool that helps ensure you achieve the correct exposure for every photo. You can use a histogram while shooting images with your camera or during post-production editing.
Tip 1: Understand Fundamental Facts About Histograms
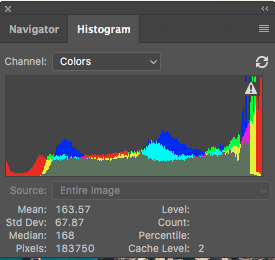
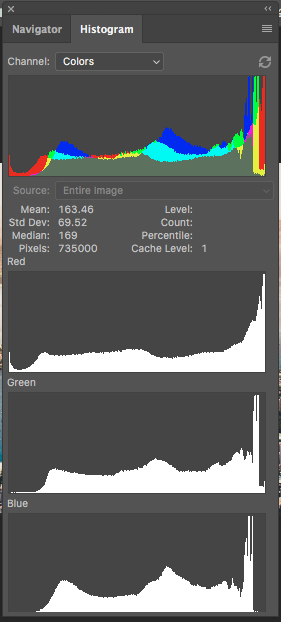
Simply put, a histogram is a bar graph that depicts a photo’s tonal values. The right side of the chart represents highlights, with the left edge portraying shadows. You can think of a histogram as representing a range of pure black on the left to pure white on the right. Mid-tones—such as greys—are represented in the middle of your histogram.
A color histogram works the same way. Colors such as yellow are quite bright, so they’ll be represented on the right of your histogram. Colors, such as deep green and blue are much darker, so they’ll show up on the left side.
The bars are a graphical representation of the number of pixels exposed in at each tone. If you see a histogram with higher bars on the left side of the graph, this can indicate a photograph of a dark subject. By contrast, a histogram skewed right can suggest an image of a light-colored or white subject. However, these types of histograms may also indicate that your subject is underexposed (in the first example) or overexposed (in the second). You’ll need to learn more about how to read a histogram to interpret it correctly in each scenario.
Tip 2: Identify the Shape of an Ideal Histogram
You’re likely familiar with the concept of a bell curve. Those types of graphs have a dome shape with a single peak at the center of the range. Often, you’ll see this bell curve shape referred to as the ideal shape of a histogram in photography.
A bell curve shape in a histogram graph shows that there are more pixels with medium brightness, with fewer pixels in both the highlights and shadows regions. This is a good indication of proper exposure in an image.
If your histogram shows too many pixels on the left and few on the right, it may be an indication that you have an underexposed image. However, you shouldn’t aim to achieve a perfect bell curve for every image. The content and character of your photos affect the shape of related histograms. For example, if you pursue photography at night, you may take a naturally dark picture against a black sky. You may have enough light to illuminate your subject but could still find the histogram skewed to the left.
Tip 3: Know When Your Histogram Reveals an Over or Underexposed Image
Even if your histogram display isn’t a perfect bell curve, it still may be perfect for your image. Always take a close look at any peaks on the left or right of your histogram and study your pictures for any signs that your exposure is off.
Another important characteristic to take notice of in your histogram is called “clipping.” Clipping occurs when you see high peaks of pixels along the vertical axis on either the left or right side. This indicates that there are areas of your photo that are too dark or too light for your camera sensor to capture details.
As you can image, it’s crucial to learn how to identify clipping when you learn how to read a histogram on a camera screen. In fact, clipping lets you know that you must correct the exposure. If you don’t, you’ll lose details in your photos that you can’t recover during post-processing.
To avoid clipping, you’ll need to learn how to use your camera light meter and manipulate the exposure triangle—by adjusting aperture, ISO, and shutter speed. Even if you can’t achieve perfect exposure when shooting, you can fix it during post-production with Photoshop or Lightroom.
Tip 4: Learn How to Use a Histogram to Edit Photos
After you learn how to read a histogram chart, you’ll want to learn how to use it in photo editing. If you know you’ll be taking pictures in bright sunlight or other conditions where exposure might be compromised, shooting in RAW is better than jpeg format.
With Camera RAW format, you retain all the details captured by your camera image sensor. A RAW gives you full control over editing so that you can enhance exposure and other elements
How to Use a Histogram for Photoshop Editing
After you become familiar with reading a histogram, you can apply this knowledge while editing in Photoshop. You can find a Photoshop histogram in several places within the software—including the histogram panel. However, using histogram features within the Levels dialog box can help you understand how more about how histograms work. You may find it easiest to practice on a black and white photo first to grasp essential histogram concepts.
Start at the menu bark, select the Image menu, then Adjustments, and then Levels. This will guide you to the correct dialog box. Your histogram will appear in the middle of the box and resemble a mountain range. Beneath it, you’ll see a scale that ranges from 0 to 255—or pure black to pure white for a black and white photo.
If your histogram shows a range of brightness levels from black to white, it is likely that your photo is properly exposed. Remember that every photo will have a unique histogram—and it may not be a perfect bell curve shape.
Be on the lookout for clipping—or talk spikes at the far edges of your histogram. If your image is overexposed, you’ll see a peak on the left, with the opposite case for an underexposed image. Also, when the tones concentrate on the left side of the image but don’t touch the right edge, that is another sign of an image that is underexposed—and the reverse is true for overexposed photos.
You can adjust your histogram using the three “input levels” buttons that appear below the graph. The left setting, or black point, has a default value of 0—with the right value, or white point, defaulting to 255. In the center is the mid-tone point, which has a default setting of 0.
When you move the black point to the right, all the tones on the left side of the new point are presented as pure black pixels. Similarly, moving the white point to the left results in all tones to the right of the new point turning to pure white. Moving the midpoint lightens or darkens all the midtones in your image.
If your image is underexposed, you can fix this by moving the white point to the left and adding more brightness. For an overexposed image, do the opposite. Move the black point to the right to increase shadows.
You may also find that some images have low contrast and appear flat. In these scenarios, you can move the white point towards the left and black point towards the right to add more contrast. Another option to try is adjusting the midpoint. Moving it to the left darkens the image while moving it to the right increases brightness.
As you can imagine, it can take some practice to master this valuable skill in Photoshop. Once you know how to read a histogram, start with some test images. That is the best way to learn the nuances of editing using a histogram.
How to Use a Histogram for Lightroom Editing
You can find the histogram feature in two places within Lightroom—the Develop and Library modules. Once you learn how to read a histogram in Lightroom, you can identify any clipping and assess the contrast of your pictures.
In the Develop Module, you’ll notice two triangles at the edge of each histogram. These triangles let you know if there is any clipping present. When clipping occurs, the related triangle will turn white.
When the triangle on the left side of the graph is white, that means that shadow clipping is present in your image. This may be acceptable, or it may indicate a problem. Click on it to learn if your shadows appear as a color—such as blue or purple. If the shadow clipping creates an undesirable effect, adjust the highlights slider to the left to add more bright tones. When highlight clipping is an issue, simply reverse the process.
If you notice a space on the right of your histogram, it indicates an underexposed image. You can fix this by moving the exposure slider right. With this approach, Lightroom automatically adjusts mid-tones to increase brightness and prevent unwanted highlight clipping.
When a photo has low contrast, you’ll see pixels bunched together in your histogram. To fix this, shift the Tones slider to increase contrast and help stretch out the image histogram display. This can help you achieve high contrast and add more depth to your photo.
You can also use your knowledge of how to read a histogram to understand how any adjustments you make on the Basic panel affect your image. And you can review a histogram after you apply Lightroom presets to learn how these professional resources make critical adjustments to exposure and contrast.
Learn How to Read a Histogram to Improve Your Photographs
If you’re new to photography, learning how to read a photo histogram graph can seem like an intimidating skill to master. In truth, learning how to read a histogram is easy—but using that knowledge to edit photos definitely takes some practice.
In essence, a histogram is a bar graph that gives you important data about your photograph. It helps you assess exposure and contrast. While each photo will likely have a unique histogram, there are some important fundamentals to keep in mind.
First, look for a continuous range of pixels in your histogram display. It’s often acceptable to have some peaks and valleys, but there are certain problems you should identify. Spikes along the edge of your histogram indicate clipping—which means you’ll lose details in highlights and shadows. Also, look for histograms that are bunched to the right or left. These graphs can show a lack of contrast or improper exposure.
When possible, you should learn how to read a histogram on camera to prevent unwanted issues in exposure and contrast. If this isn’t possible—either because your camera doesn’t have a histogram feature or your shooting in less-than-ideal conditions—know that you can make adjustments in post-production. They’re key elements in the best photo editing software programs and apps, such as Lightroom and Photoshop. You may find it helpful to use some test photos and work through some histogram examples to learn the basics before editing your own images.
Without a doubt, learning how to read a histogram is essential for excellence in digital photography. Spending some time on this vital photography concept will help you level-up your skills and enter a new world of artistic possibilities.